
TD Economics recently published its latest report, entitled "Questions? We've got answers: Addressing issues impacting the economic and financial outlook." Below is a selection of questions from the report. To read the full report click here.
Give peace a chance: how has the global outlook evolved?
The global outlook has soured since last quarter's update. The war has provided another updraft to commodity prices, deepening supply reliability concerns. In Europe – a major importer of energy products – higher prices are acting as a de-facto tax on households and businesses. As expected, European states continue to look for ways to offset the crunch on households, with some unveiling multi-billion-euro support packages. How the governments will pay for these programs varies greatly. In Germany, authorities are set to increase borrowing by roughly 40 billion euros to offset the economic effects of the war. Italy will up the rate on a windfall tax introduced in January on energy firm profits to fund their support program.
After only a brief reprieve, more supply chain disruptions have materialised. A stoppage in production at several German auto manufacturers due to an inability to import bespoke wire harnesses from Ukraine captures the new challenges. Suppliers' delivery times across the euro area are lengthening once again, giving back the marginal improvements that took hold through February.
Offering a buffer to the war's economic impacts, the service sector is getting a post-Omicron lift, particularly in major tourist destinations.
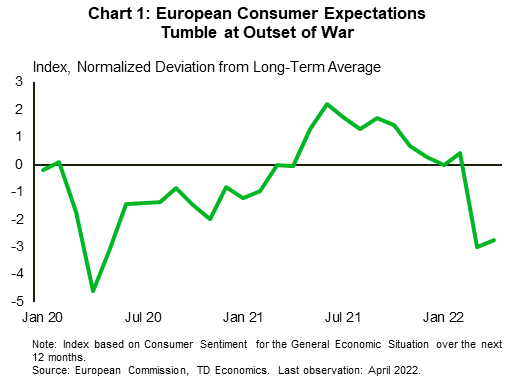
Moving forward, the resilience of consumers will be tested as the rapid rise in living costs erodes real incomes. Adding to the challenge is a more hawkish monetary policy outlook that will add to debt servicing costs. Despite pockets of economic strength, recent events are taking a heavy toll on consumer sentiment, which can be expected to impact expenditures (Chart 1).
Apart from the war, the ongoing economic slowdown in China is forcing a rethink of global growth prospects. April data showed a slowdown in export growth as rising inflation and a rotation in consumer spending towards services in advanced economies dents goods demand, while Chinese imports were flat for a second consecutive month. Moreover, signs are building that the ongoing COVID containment measures in China are impairing domestic demand as April retail sales contracted on a year-over-year basis for the second consecutive month. And, the official services PMI readings have been signaling contraction for March and April.
The combination of Europe's energy-import dependence and other economic links to Ukraine and Russia, along with export ties with China (particularly in the case of Germany), leaves the region vulnerable to more stagflation forces relative to North America as we head into the second half of this year. Indeed, growth in the Euro Area is likely to register slightly below 3% this year, whereas expectations prior to the war were for a 4% expansion.
Has the impact in Canada and the U.S. been different?
For both the U.S. and Canada, the impact of the war has been most apparent in consumer inflation data. The combination of higher food and energy prices has pushed measures of headline inflation to 8.5% and 6.8% y/y in the U.S. and Canada, respectively. Food and energy have contributed to nearly half of that increase. Like Europe, the inflationary impulse has acted as a tax on households, eating into disposable income and likely leading to some curtailing in spending on discretionary items over the near term. From the U.S. perspective, recent surveys have started to corroborate this narrative, with households showing that they plan to cut back on dining out, cancel a vacation or even delaying purchasing a new house or car if current price pressures persist.
Luckily, labor markets on both sides of the border remain incredibly tight. This has led to an acceleration in recent wage pressures, buffering some of the erosion in spending power, which differs from the European experience. Wages are up 5.5% y/y in the U.S., though have lagged at 3.3% y/y in Canada. Households also maintain significant excess savings as another layer of protection. However, at the end of the day, higher rates coupled with elevated price pressures will slow spending. In fact, monthly U.S. consumer spending data has already shown early signs of goods spending moderating, with outlays on motor vehicles, household furnishings, and clothing & footwear all receding in March.
This isn't a bad thing. It's necessary for domestic demand to ease its foot off the peddle to restrain rampant inflationary forces. Unlike Europe, the price metrics in Canada and the U.S. have shown a broadening in price pressures outside the food and energy sectors for some time.
U.S. spending on services has outperformed as easing COVID restrictions facilitates some normalization in consumption patterns. Canada has lagged due to longer and harsher health measures over the winter months, but a similar pattern is now playing out. The common thread between both economies is that if higher prices force consumers into making tough spending decisions over the coming months, households will likely prioritize services over discretionary goods spending.
Lastly, both Canada and the U.S. are net producers of energy commodities, and this creates another layer of economic buffer. However, it does fuel more regional variation. For example, while many businesses are faced with higher input costs, firms in the oil and agricultural & mining sectors are all reporting a windfall. Within Canada, this should continue to support employment growth in commodity producing provinces (such as Alberta). The impact is also evident within provincial budgets, where rising tax revenues in commodity-focused provinces are dramatically improving their fiscal outlook.
How has the sand shifted under supply chains?
The first wave of supply chain issues was broadly dispersed across the globe, as pandemic restrictions forced closures of producers and an abrupt stoppage to transportation links. The restrictions were then followed by an unprecedented rise in durable goods demand (primarily from the U.S.), leading to a supply-demand mismatch. Containers were stranded in locations where they weren't needed, while the auto sector lamented a tremendous underestimation of the need for semiconductors.
The supply chain pressures have since become more localized and nuanced. North American automotive production is rebounding from the lows last year but is still coming from behind. U.S. manufacturers in general indicate better supplier delivery conditions, as ports have increased capacity (through longer operating hours). Most importantly, goods demand in advanced economies has started to wane as the rotation to services spending gains steam. The shift in demand has been a necessary condition to taking pressure off manufacturers and logistical networks. This move will also improve resilience going forward, as additional shocks will affect a smaller share of the consumption puzzle, limiting the economy-wide inflationary impacts.
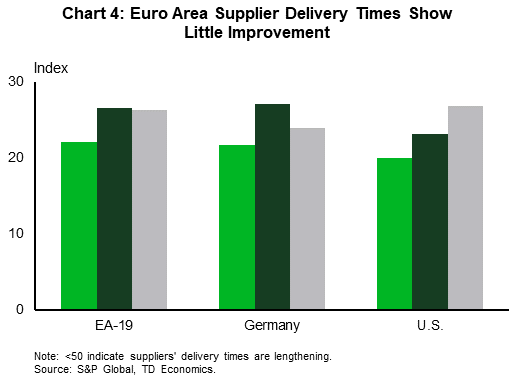
That said, the dual shocks in Ukraine and China present a renewed threat to global economic linkages. As previously noted, the former has already forced temporary shutdowns at European automotive manufacturers. Across the euro area (and in Germany in particular), delivery times are lengthening again, while input cost inflation accelerates (Chart 4).
Moreover, a few product categories are standing out as facing a substantial crunch. Ukraine was a major producer of neon gas – a key input in the production of semiconductors. Firms held reserve stocks of the gas prior to the war, but the longer the conflict continues, the more desperate the search for alternative sources will become.
The start of the war also saw wheat prices surge as Ukraine and Russia are major global exporters. The risk of another move higher in prices looms as U.S. fertilizer prices are now up over 70% since last May and roughly 170% since 2019. Prices have surged in tandem with natural gas costs and worries about mineral supplies from Russia and Belarus. Reduced usage of fertilizer to control costs risks smaller agricultural yields going forward, reinforcing the inflationary cycle in food prices.
One supply chain influence that hasn't changed as much is China's commitment to zero-COVID. Although the country has mitigated production work-stoppages relative to the peak of the pandemic, domestic policies continue to create friction. Reports of logistical challenges have led to lengthening supplier delivery times and growing stocks of finished goods. Ports within China are once again facing backlogs.
However, this time around, some companies have been able to adjust. Vietnamese exports have been remarkably robust, suggesting some global demand substitution is occurring amid Chinese lockdowns. When combined with a softening in the demand for goods within advanced economies with the rotation towards services, the aggregate impact from supply chain disruptions should be more modest than before.
Stagflation? I read the news today, oh boy…
Reading the business press these days can certainly raise anxieties: "The global stagflation shock of 2022: how bad could it get?" – FT, "Hi, Stagflation" – Forbes, "Cash is the Only Winner in a Market Gripped by Stagflation Fear" -BNN.
Stagflation is a term often used these days, but is not one that comes from economic theory, with a broadly agreed upon definition. The term was coined in 1965 by the UK's Chancellor of the Exchequer to describe the UK's period of high unemployment and high inflation.
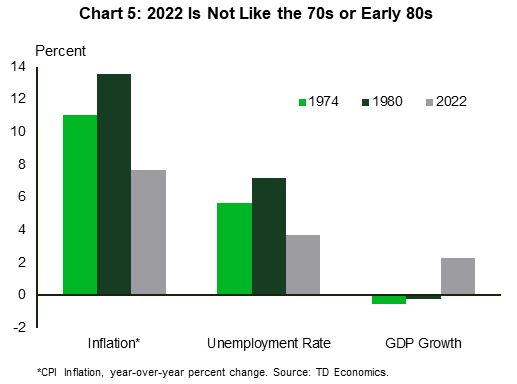
The concept arose because that period broke the Keynesian mold that there was an inverse relationship between unemployment and inflation – i.e., when unemployment was high, inflation was low, and vice versa. Its use to describe the situation today is paradoxical. Unemployment rates in the U.S. and Canada are at indisputably low levels, while inflation is high, precisely as Keynesian economics would predict (Chart 5). Now some interpret the "stag" in stagflation as low economic growth – and indeed growth in the U.S. is looking quite soft in the first half of the year. However, it is coming off a very strong expansion at the end of 2021 and is being weighed down by a normalization in the pace of inventory building and drag from net exports. Underlying domestic demand, while more modest than the heady days earlier in the recovery, is still resilient and running above trend.
We also expect inflation pressures to ease in the coming quarters through a combination of lower commodity prices, base-year impacts, tighter monetary policy and capacity constraints on growth easing demand pressures in many areas. In Canada, headline CPI is expected to peak on a year-over-year basis at close to 7% in Q2, and ease to about 5% by Q4 – still well above the Bank of Canada's target. Similarly, U.S. CPI inflation likely peaked in Q1, and we expect it to ease slightly, but remain elevated at 6.3% in Q4 2022, and return to the Fed's comfort zone by the end of 2023.
Given that inflation will be stubbornly high despite decelerating, the word stagflation may remain in the media for some time, particularly as the economic drivers normalize to growth patterns closer to (and even below) 2%. However, we prefer to stick with the traditional application that requires rising and higher unemployment. This is the true measure of risk to the economy.
Are inflation expectations at risk of becoming unanchored?
Given that inflation is running at multi-decade highs around the world, it is surprising that expectations over the medium to long-term have remain reasonably anchored. Certainly, we have seen surveys of businesses and consumers pointing to 3%+ inflation over the next two years, but after that, the belief that central banks can rein in inflation remains strong. Market pricing shows inflation expectations over the 5- to 10-year horizon stable at around 2.5% to 3%, above the average since 2015, but in line with average expectations before that period.
Market pricing for U.S. inflation over the next 5 years does not strongly disagree with the Federal Reserve's projections from March. The central tendency of FOMC members at the March meeting had inflation above 3% on average over the next 3 years.
This year's run-up in inflation expectations has coincided with a substantial increase in expectations for the federal funds rate, weakening financial conditions in the bond and equity markets, and a downgraded growth outlook in Europe and China. Our interpretation is that markets are adjusting to two factors: (1) a weaker external environment than expected, and (2) a realization that monetary policy will need to be tighter than previously expected. As these dynamics unfold, it becomes a circular process that helps to anchor long-run inflation expectations. There’s no getting around the requirement that economic growth must slow below the trend pace to mitigate the inflationary risks.