
TD Economics recently published its latest report, entitled "Questions? We've got answers: Addressing issues impacting the economic and financial outlook." Below is a selection of questions from the report. To read the full report click here.
How have global economic conditions evolved since the September quarterly outlook?
Economic growth has generally disappointed while inflation has shown more heat. In the third quarter of 2021, U.S. real GDP is estimated to have grown by 2.1% (annualized) and Canadian GDP by 3.4%, 1.3 and 0.6 percentage points percentage points lower respectively than expected in September. The main culprits for the miss were worsening global supply constraints, fading fiscal stimulus and Delta virus-related headwinds. Fortunately, economic rebounds are evident for the fourth quarter, though floods in British Columbia add downside risk to the Canadian outlook.
Economies of China and Europe have shown mixed performances. China posted a downside surprise to growth in Q3, as its economy succumbed to a toxic mix of supply chain issues, dwindling coal supplies, blackouts, regional lockdowns and a regulatory push to limit borrowing in the property sector. In contrast, Europe managed to outperform in the third quarter, but is losing momentum into Q4 due to surging natural gas prices and another uptick in Covid-19 cases.
Supply constraints are showing more staying power than anticipated, causing economists and central banks to serially revise up near-term inflation forecasts. Significant relief now appears unlikely until the second half of 2022. This will leave headline CPI running just shy of 4%, on average, in the U.S. and Canada, nearly a percentage point higher than we expected in September.
The higher trajectory of inflation in the first half of next year will eat into real disposable incomes in North America and globally. This would normally lead to significant downgrades in 2022 economic growth performances, but the outlook is buttressed by 1) large pools of excess savings that continue to support spending patterns, 2) ongoing growth in job opportunities and 3) in Canada, higher fiscal spending than initially forecast.
Where are we now in the battle against Covid-19?
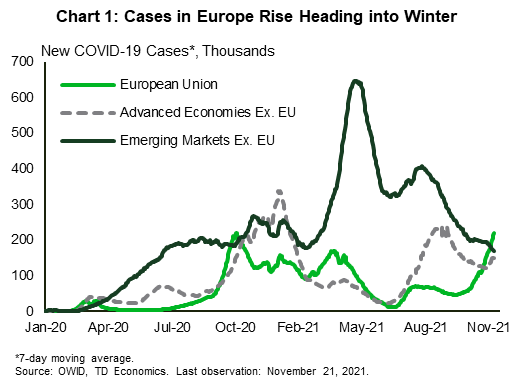
Globally, Covid-19 cases are rising again after several months of decline. The increase is most notable in Europe, while emerging markets have recorded a sharp improvement since the summer peak (Chart 1).
In Europe, Germany is facing its most severe wave yet, as cases have surpassed all previous highs. Yet, in Spain, France and Italy (countries that suffered mightily in earlier waves) a relatively small uptick has been registered. In response to rising caseloads, countries are adopting modified restrictions. For instance, Austria is currently only subjecting those that remain unvaccinated to new public health measures.
China remains committed to a zero-Covid policy, which has been one among many factors contributing to global supply chain issues. With the 20th National Congress set for next year, it is possible authorities elect to keep this policy in place until 2023. We've seen the knock-on effects this can have globally, with the shutdown of a terminal at the Ningbo-Zhoushan port (the third busiest in the world). However, China will need to weigh this hardline approach against the need to encourage corporations to expedite supply chain resilience plans via country diversification and domestic production.
The U.S. and Canada are generally in good shape, recording caseloads and hospitalizations well below their previous peaks. Seasonal influences are starting to come through, with infection rates trending higher in the U.S. northeast (Charts 2 and 3) and in Ontario and Quebec, as colder weather prompts more indoor activities. So far, governments are, for the most part, not signaling the re-imposition of tighter restrictions, particularly among highly vaccinated populations, with third dose protocols rolling out. However, it remains a risk that cannot be dismissed, as we proceed through this “testing” phase of the endemic.

So far, 30 million boosters have been administered in the U.S. since August when they became available to people with weakened immunity. Eligibility was extended to seniors and others at risk of severe Covid-19 in late September, and some jurisdictions have expanded access even further. In Canada, most provinces are readying plans to inoculate children aged 5 to 11, as well as provide booster shots to vulnerable segments of the population.

With increased access, vaccination rates are likely to continue to edge up. At last count, 77% of the total population was fully vaccinated in Canada, in line with Europe and above the 59% comparable rate in the United States.
The potential spread of the virus in the coming months could prompt more governments to implement new restrictions. Any new measures adopted are likely to be more targeted and less economically disruptive than those in past waves, given the growing use of vaccine passport systems, mandates and other tools. Some jurisdictions have moved pre-emptively, including Ontario, to pause further reopening plans of high-risk settings in the hopes of avoiding “rollbacks” among those businesses already in higher operation.
In sum, an outbreak this winter should have far less impact on economic growth. We could see some slowing in growth in high-contact services in regions with elevated covid levels, but the impact on national trends is likely to be marginal.
How will supply chain challenges and higher energy prices impact the 2022 outlook?
The autumn months saw energy join the list of supply-side impediments impacting the global economy. An energy supply crunch in China and Europe sent natural gas and coal prices skyrocketing, with knock-on effects to North American natural gas and world oil prices. The supply squeeze has left a particular mark on base metals and energy-intensive manufacturing industries – such as aluminum, zinc and fertilizers. Elsewhere, weather disruptions have elevated crop and food prices.
The jump in oil and gas prices contributed to consumer price indexes hitting multi-decade highs in October. Although these impacts are visible and easier to monitor within the data, it is much more difficult to extract the broader impact of unprecedentedly intricate global supply chains. Used and new vehicle prices were once the sole example of supply-chain disruptions, but a broad array of goods and service sectors now carry the markings. This is consistent with purchasing manager surveys that show an increasing share of businesses are passing higher input costs to the end consumers.
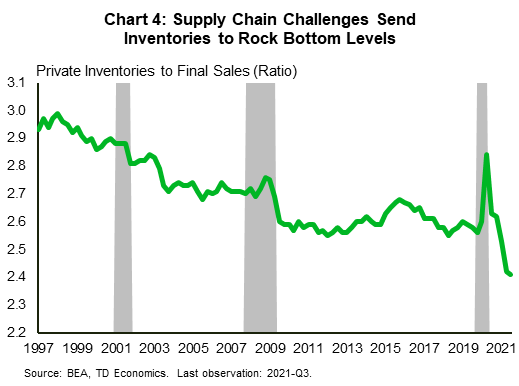
One way to see how supply chain challenges are leaving a mark on U.S. economic growth is through the restraint on vehicle sales and the inability of firms to build inventory more broadly across sectors. The inventory-to-sales ratio is at an historic low (Chart 4), with the drawdown subtracting almost two percentage points from GDP growth in the first half of the year. The rebuild phase will add significantly to growth in future quarters, but it is occurring more slowly than we originally anticipated, leading to a net downgrade to our near-term outlook relative to September.
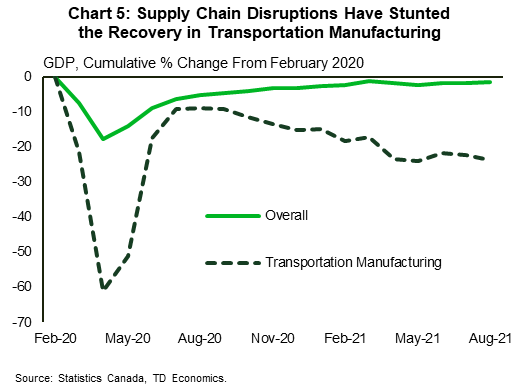
In Canada, where data are less timely, the most pronounced growth effects of supply shortages have been observed in transportation manufacturing (Chart 5). As of August, GDP in the sector was down nearly 25% relative to pre-pandemic levels.
Even with these supply-side pressures proving more prolonged than we had anticipated a few months ago, the intensity of bottlenecks should ease in the coming months. There is already evidence that this process is underway through a few channels:
- An incremental rotation in spending towards services, which remains below pre-pandemic levels.
- A waning in the Covid-19 crisis, particularly in emerging markets, where vaccines are starting to become more widely distributed.
- Less stimulus – as governments cease “cutting checks” for immediate pandemic income supports and central banks remove monetary accommodation.
Still, the supply system will remain fragile in the near term and susceptible to additional shocks. The devastating floods in parts of British Columbia are a case in point. The flooding has damaged highways, disrupted rail service, halted fuel flows on the TransMountain pipeline, and impeded transportation access to Canada's largest port – the Port of Vancouver. Reports of stockpiling and empty grocery shelves have resurfaced, and the provincial government has instituted a gasoline rationing order in parts of the province. While highways, rail service, and flows to the Port of Vancouver are being restored, these delays will weigh on Canadian real GDP growth in the fourth quarter.
Although we anticipate that year-over-year inflation rates are likely to begin to roll-over by mid-2022 and energy prices to begin subtracting from the headline rate by this point, we still expect the inflation environment to remain higher relative to the pre-crisis period due to firmer demand drivers. For instance, we anticipate core inflation to be around 3% in both Canada and the U.S. at the end of 2022 compared to a rate under 2% in the decade prior to the pandemic.
Given the unusually high uncertainty around global supply, it will be important to follow some leading indicators: monthly purchasing managers' surveys, global freight rates among data sources.
What if we're wrong and these headwinds prove more persistent?
We conducted a thought exercise examining the impact on medium-term growth among key economies in the event that the trifecta of risks take one-to-two quarters longer to abate relative to our baseline assumptions. These include elevated inflation and energy prices, as well as a greater-than-expected slowdown in China’s economy. The full report can be found here.
We estimate that global growth could fall 0.6 percentage points (ppts) short of current expectations, equivalent to roughly $570 billion in foregone real value added. China would suffer the most, potentially losing out on 1.4 ppts of growth in 2022. Among advanced economies, Eurozone growth could miss by 0.8 ppts, while the U.S. and Canada could miss by 0.7 and 0.6 ppts, respectively. These estimates offer guidance rather than precision, as it is difficult to estimate the knock-on impacts to the “confidence” channel. However, the over-riding message is that the Canadian and U.S. economies would be meaningfully negatively impacted, but recessionary forces failed to materialize within the modelled outcomes given the starting point of these economies.
What are the risks posed by excess household savings to the consumption and inflation outlook?
Americans have built a $2.7 trillion cushion of excess savings over the course of the pandemic, amounting to roughly 13% of nominal GDP. However, excess savings have now stopped accumulating. The personal savings rate returned to its pre-pandemic pace in September and is likely to edge below that level in the quarters ahead.
It is highly uncertain how much of these savings will be spent versus saved and invested (either directly or indirectly). The bulk of savings are held by higher income households with a greater propensity to save. However, modest income households have built-up nest eggs far higher than their pre-pandemic levels (Chart 7). In a recent report, we outlined a couple of scenarios for the upside risks to consumer spending and resulting inflation depending on what share of savings is ultimately spent. Our baseline assumption was that 5-10% of these reserves are spent over the next two years. Given strong consumer spending data up to October, there is likely upside risk to that assumption. The possibility that consumers go on a larger post-pandemic spending spree is the largest upside risk to growth, and inflation.

Canadian households continue to amass excess savings too. According to our estimates, consumers have built up $190 billion in extra savings in deposit accounts that can be easily accessed and deployed towards consumption (see report). Of note, Canadian households face competing priorities, such as paying down high levels of existing debt relative to their U.S. counterparts.
In the recent Bank of Canada Survey of Consumer Expectations, respondents said they had intended to spend about one-third of their accumulated savings by the end of 2022. Using the $190 billion in deposits as an approximation of “savings” implies a spending impulse of around $60 billion (3% of GDP) over the next several quarters.
By our calculations, the Bank of Canada’s MPR embedded around a $40 billion increase in spending through a drawdown in excess savings over the three-year projection. In their forecast, this contributes to robust consumption growth of around 5% to 6%, and above-target inflation of 3.4% in 2021 and 2022. If consumers spend the full $60 billion as they had indicated in the Bank’s own survey, this could lead to higher inflation in the near and medium term. Likewise, the Bank would respond in kind with higher interest rates.
Will rising interest rates derail housing markets?
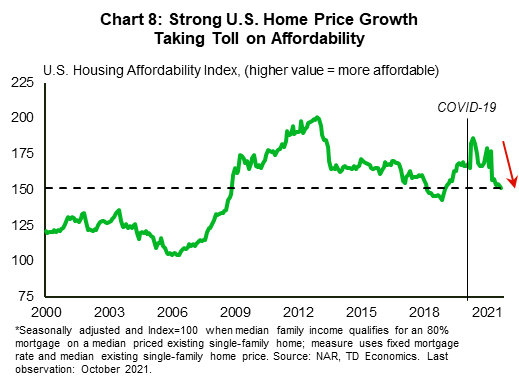
The sharp increase in U.S. home prices soon after the pandemic's initial wave outstripped income gains and the benefit of lower interest rates (which troughed in early 2021), thereby taking a toll on affordability. The latter has trended down over the past six months and is now near early 2019 levels, according to a popular NAR measure (Chart 8).
Looking ahead, further healing of the labor market will help on the income front, but higher interest rates will likely further stretch housing affordability. This will weigh on demand and eventually take some steam out of home price growth. CoreLogic home price data already point to a recent slowdown in home price growth, from an unsustainable 25% (annualized) pace in mid-2021 to a more moderate (though still strong) 15% in September.
While a continued deceleration is the most likely outcome, several other forces will ensure a floor on price momentum. A dearth of inventory is one of the main supporting points. Existing home inventories remain at around 1.3 million – among the lowest levels in recorded history with data stretching back more than two decades. And while homebuilders continue to put more shovels to the ground, current homebuilding trends suggest that relief from new supply will be gradual. Putting the pieces together, price momentum will slow but remain in positive mid-single digit territory by the end of next year.
In Canada, higher interest rates will slow but not upend market activity. October’s data is a glaring example, as sales jumped 9% month over month despite mortgage rates starting to trend up, albeit modestly.
Supportive fundamental factors to the market include rising employment and incomes, high savings and a resumption in stronger population growth from immigration flows. In addition, a large chunk of the population has aged into what have historically been prime homebuying years. Previously implemented stress tests mean that most Canadians have already been qualifying for home purchases at rates that are much higher than current levels. This suggests significant room for rates to rise before qualification thresholds are threatened.
The affordability backdrop in Canada is a complicating factor. The rapid house price growth has left affordability at the worst level since the mid-1990s. While this could amplify the impact of rate hikes, affordability was even worse from the late 1980s through the mid-90s, and sales managed to avoid a sustained retrenchment (Chart 9). And, although it’s not an apples-to-apples comparison, the economic backdrop is expected to be stronger than those periods, alongside a new and resale supply market that are currently drum-tight -- a stark difference to those periods. The tight market conditions argue for positive price growth, even as higher rates take some steam from demand.
