

By Beata Caranci
Senior Vice President and Chief Economist
TD Bank Group
Highlights
- Recent events have prompted us to take a cleaver to our near-term outlook for the U.S. and Canadian economies.
- Under the assumption that extreme disruptions in activity drag into May, real GDP and employment are expected to decline at an unprecedented rate in the second quarter, before bouncing back in the second half of this year.
- Ultimately what matters is whether governments and central banks are successful in levelling out the risk through their equally-unprecedented actions. Doing so would avoid a domino effect that would turn expectations of a V-shaped economic shock into a more insidious U or even L shaped outcome.
- We must allow enough time to pass to evaluate measures that have been put in place to mitigate broad scale insolvency and income losses. This will take nerves of steel, but there’s some comfort in the current experiences in China and South Korea that are already rebooting their economies.
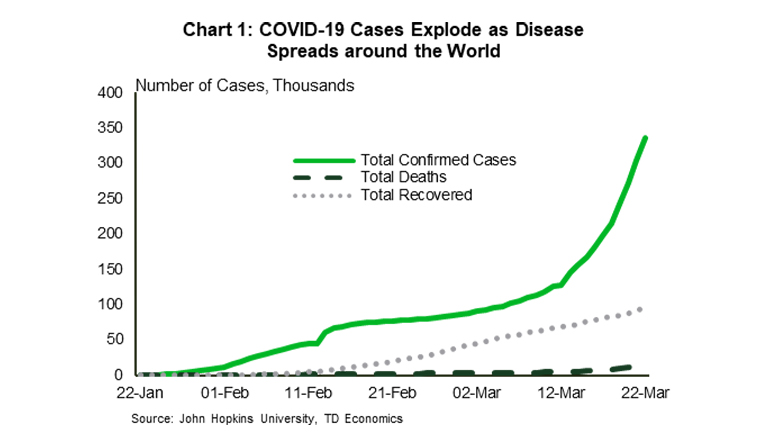
Well, we’re living up to our word. In a Perspective written a week ago, we noted that unchartered waters require ongoing forecast adjustments in real time. Policy decisions are flowing at rapid speed. Our March quarterly economic outlook was issued only a week ago and since then news hit on border closures and more stringent social distancing tactics within a number of American states and Canadian provinces. We are also now getting our first glimpse of some sobering data on unemployment claims. Together, this has prompted us to slash our near-term forecasts for the U.S. and Canada dramatically.
Brace yourself for some horrible data in the near-term, as there’s little doubt that the second quarter will produce some painful and likely historic figures on job losses and economic contraction. However, we encourage our readers to not hit the panic button when those figures start to roll out.
Ultimately what matters is whether governments and central banks are successful in levelling out the risk through their equally unprecedented supports. Doing so would avoid a domino effect that would turn expectations of a V-shaped economic shock into a more insidious U or even L shaped outcome. We must allow sufficient time to pass to evaluate measures that have been put in place to mitigate broad scale insolvency and income losses. This will take nerves of steel, but there’s some comfort in the current experiences in China and South Korea that are already rebooting their economies.
In order to provide a sense as to how forecasts will change depending on underlying assumptions, we consider a scenario whereby disruptions via social distancing ebb by mid-April, versus a more drawn out period through May. We have chosen the longer duration to May as the baseline view in light of recent guidance by various health and government officials that social distancing measures have the potential to remain in place for months. As we chase forecasts down, there will continue be far more pessimistic views being bandied about. We have been aiming to find a balance between setting realistic assumptions and not being overly ‘alarmist’ in the absence of supportive hard data.
Policy makers moving swiftly
The past few weeks have provided some comfort in the eye of the storm. Government and central banks around the world have been throwing everything and the kitchen sink to provide support to credit flows, liquidity and incomes. The truth of the matter is that it will take several more weeks to gauge their effectiveness.
The speed of the decline in interest rates is without precedent. The Fed slashed rates by 150 bps to the lower bound in just over a week. And in roughly the same amount of time, the Bank of Canada cut its policy rate by 100bps.
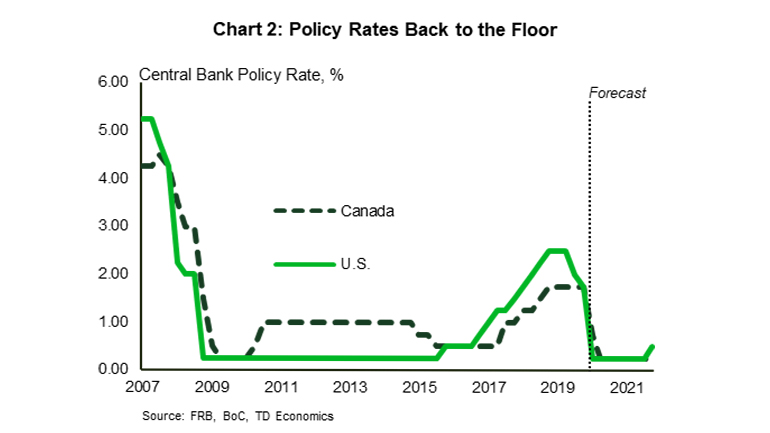
Investors anticipate at least another quarter point reduction by the Canadian central bank at its next fixed announcement date on April 15, but in this fluid environment anything goes in terms of timing if there is a greater sense of urgency.
In terms of government fiscal measures, the list of announcements made by jurisdictions around the world is lengthy and growing by the day. The basic theme has been to assist – but not necessarily ‘solve’ – households and businesses as they face declining incomes and corporate profits, since the scale of making everyone whole is simply too large. The measures are acting as a bridge over a deep gorge to get the economy back on track with the fewest permanent job losses and business insolvencies.
That being said, some countries have been more active than others. For example, consider the large differences in business lending support across countries:
Lending support measures in Germany and France are among the more generous policies. France has offered some €300B (~12% of GDP) in government guarantees for bank loans for businesses of all sizes affected by COVID-19. This guarantee covers up to 90% of business loans for six years or longer, with flexibility on duration and loan repayment schedules. Germany’s loan guarantees are also substantial, at more than 20% of GDP, and available to both small and large firms.
By comparison, Italy’s hard-hit businesses are receiving relatively modest guarantees of ~0.5% of GDP, likely an outcome of the government’s weak fiscal position.
In Canada, as part of its COVID-19 Economic Response Plan, the federal government announced loan support to small and medium-sized businesses through Export Development Corporation and the Business Development Bank of Canada of about $10-billion or 0.5% of GDP. This was accompanied by OSFIs announcement of a 1.25% capital buffer reduction that is expected to free up $300-billion of lending capacity at Canadian banks. However, this too is on the ‘weaker’ side of options and we expect further measures going forward.
In the United States, the federal government was slower in unveiling a comprehensive fiscal package, but it made up for it with its agreement on a $2-trillion fiscal support package (10% of GDP) that looks to include $250-billion in direct transfers to households, $250-billion for expanded unemployment insurance benefits, $350-billion in small business loans, and $500-billion in lending support to distressed businesses. Meanwhile, the Federal Reserve – as part of its recently-unveiled bazooka of liquidity measures and facilities aimed at ensuring the flow of credit – indicated it would soon roll out a Main Street Business Lending Program that would further bolster lending to small and mid-sized businesses through the Small Business Administration.
In Canada, Federal Finance Minister Morneau suggested that the $27-billion or 1.3% in direct new spending (excluding loan guarantees) that was announced last week likely represents just the first phase. For now, we have not incorporated any additional stimulus.
Getting to the other side of the gorge
As we await signs that fiscal and monetary policy measures are gaining some traction, the space will be filled with an ugly data flow. This was hinted by a smattering of reports already released for March. The U.S. Philly and Empire Fed surveys both showed manufacturing crashing to their largest declines on record last month. However, even more eye-opening were last week’s data on weekly jobless claims that highlight the degree of job market disruption. Across the pond, Markit flash PMI numbers for March showed the Eurozone and the U.K. registering the steepest declines in business activity ever recorded, especially in the services sector.
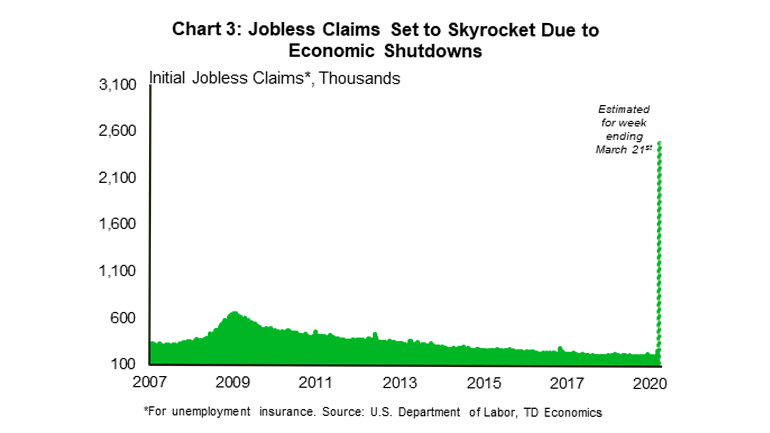
Stateside, weekly claims increased +70k in one week – to 281k – which the Department of Labor officially chalked up to COVID-19 impacts. While the level remains low, this is about to change. Preliminary data issued by various states ahead of this Thursday’s national release suggest that weekly jobless claims could spike to more than two million, which would be well above the peak of around 700k during the 2007/08 financial crisis (Chart 3). Recall that the unemployment rate hit 10% at that time.
Canada is showing a similar pattern, with the federal government announcing a stunning jump to around 930,000 new EI claims during the period March 16-March 22. That is up from the typical level of around 45,000 applications in a comparable week.
Importantly, the rise in the unemployment rate may not show as much in March monthly employment reports, because the spike in claims are occurring just after the mid-month survey period. That means that there will be a concentrated shock on the unemployment rates in both countries in April. Typically, jobless rates rise gradually over several quarters during periods of recession, rather than a single month. But this cycle will show a very concentrated shock. As an example, the biggest one-month increase in the U.S. unemployment rate during 2008 was 0.5 percentage points. Over a quarter it was 1.5 percentage points. The greatest jump was in 1975 at 2.1 percentage points. Today we could surpass that quarterly spike in April alone, which would be historic – like this pandemic.
If fiscal and monetary policies prove successful, and social distancing tactics gradually ease, the unemployment rate should level off after one-to-two months and quite possibly fall just as fast if workers are called back to work. There will likely be some permanent scaring in that time frame, but not for the bulk of workers as long as the duration of the shock remains contained to one or two more months.
This underscores a key assumption occurring with us and most forecasters. At least for now, these layoffs are considered largely temporary. Given that there’s more front-loaded income support from the government than in any other recession, we are still holding to the view that consumers and businesses should bounce back up.
Stop-enomics to deliver historical blow to activity
Given this past week’s flurry of developments, we have taken a cleave to our near-term forecasts for GDP and employment. These forecasts assume that the extreme virus-driven stoppage in activity extends through mid-May, with recoveries starting thereafter. Under this scenario:
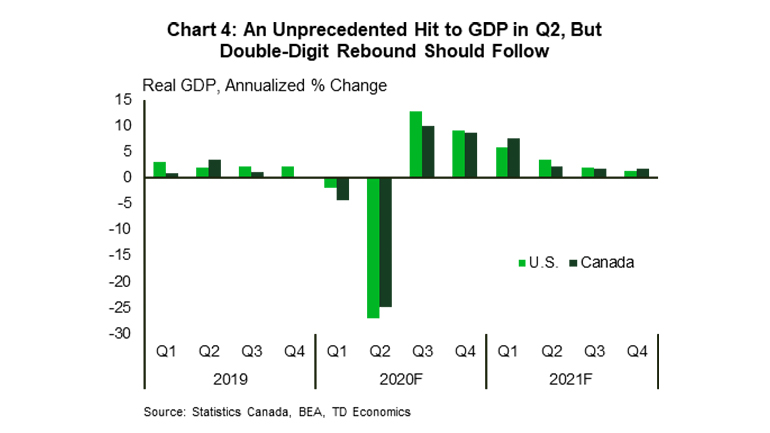
U.S. real GDP is now expected to contract in both Q1 and Q2, by an annualized 1.9% and 27.0% respectively (Chart 4). Even with a sharp rebound beginning in Q3, annual average output is expected to decline by 3.5% for the full year 2020. Next year, growth is likely to rebound by 3.6%.
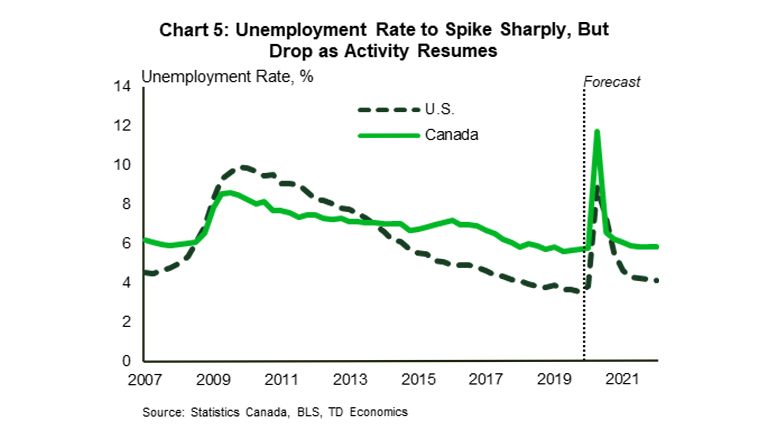
The unemployment rate likely to more than double from 3.5% to 8.8% on average in Q2. (This average conceals a spike in April followed by lower readings in the April-May period.) By year end it should fall to just above 5%, still well up from its pre-virus level, before gradually converging closer to the 4% level in 2021 (Chart 5).
The hit to Canada’s near-term profile is even deeper than the U.S., with real growth rate now set at -4.4% in 2020. This annual projection imbeds quarterly real GDP declines of -4.4% and -24.8% in the first two quarters of the year followed by an average annualized rebound of 9% in the second half. Underperformance is partly explained by the comparatively large negative impact of the plunge in oil prices and a more fragile Canadian household relative to its U.S. counterpart. Next year’s bounce back in 2021 (+3.4%) is on the tepid since, with not all of this year’s losses projected to be made up.
Canada’s unemployment rate is projected to temporarily soar to an average quarterly level of 11.7% in the second quarter before heading back to around 6.2% by year end.
We have also scaled back both Canadian and U.S. yields significantly, factoring in recent rate cuts as well as a further likely 50 bps move by the Bank of Canada by April. A mix of global QE and persistence in weak inflation expectations are projected to hold yields across both curves up to the 10-year tenures to well below 1% over the remainder of this year. Some modest upside in yields is projected in 2021 though levels will remain extraordinarily low.
The Canadian dollar is expected to remain under further bouts of downward pressure until the late spring, at which time the U.S. dollar should begin to pull back from the stratosphere. Our year-end target however of 72 US cents is expected to hold well below its levels of around 75-77 US cents prior to its recent virus-related plunge. Weak oil prices will remain a constraint for the Loonie. We have trimmed our average WTI price for 2020 to around US$35 per barrel.
Duration is what matters
Forecast outcomes hinge critically on assumptions around the persistence of the shock. As an illustration, if the disruptions ended in mid-April – a month earlier than our baseline assumption, real GDP in both the US and Canada would still shrink sharply in the second quarter, but about 10 percentage points less (at annual rates) than in our baseline. The unemployment rate would peak at a far lower 6.5% stateside and 7.5% north of the border.
Even our deeper baseline scenario above anticipates a short painful contraction followed by a V-shaped recovery. This would set it apart from the 2008 experience, or any other, considering our expectation for a sharp drop in activity. However, during the global financial crisis, the U.S. economy contracted a full five quarters before embarking on a protracted U-shaped recovery.
Ultimately that will depend on how effective measures are in flattening the outbreak curve. We do not have much line of sight there, although we draw some comfort in China, South Korea and other Asian countries seeing a slowing in their outbreaks. In addition to the success in containing the number of new infections, China now appears to be embarking on a classic V-shaped recovery. China’s contraction in Q1 2020 may in fact turn out to be double digit – indeed, some estimates of the decline have been as large as 15% to 20% annualized. China has never shown a contraction in the history of its reported data and will do so in a grand manner for the first time. But, recent reports indicate that 60% of small and medium sized enterprises and 90% of manufacturers are now back into operation. This is still short of full capacity, but it is promising. South Korea is also finding success in tapering cases and is seeing a re-emergence in economic activity.
These countries in the East took more proactive and aggressive testing and quarantine measures than what we’ve seen so far in the West, particularly relative to Italy’s experience, which may be the textbook on everything going wrong.
They may prove to be the outlier, but we just don’t know yet. Interestingly, even amid the known outbreak in Italy in March, the country appears to have recorded solid retail sales through that month, indicating that “soft” social distancing tactics didn’t influence population behaviors. Hopefully there’s more awareness in North America from that experience. But, on this front, we harbor more concern on the potential for the U.S. economic shock to be longer than in Canada due to less consistent social distancing polices across states and national policy – at least up until very recently – coupled with a slower start to virus testing.
Bottom line
With respect to the outlook, the most critical aspect is not so much the depth of the contraction, but the duration. The consensus continues to chase down forecasts of Q2 activity on both sides of the border – with some estimates far deeper than those of TD Economics. However, if the disruptions are contained to one or two more months, activity should rebound forcefully with supports in place for household and business incomes. The longer these disruptions last, the greater the risk of domino effects that would turn expectations of a V-shaped shock into a U or even L shaped cycle.