
Since 2022, there's been two separate economic realities in the U.S. as the gap continues to widen between top-earning households and everyone else. This has resulted in what economists call a K-shaped economy, where some consumers and industries are seeing gains in wealth, wage growth and employment, while those at the bottom are trending downward, creating a graph that resembles the shape of a “K.”
These differing consumer realities have been reflected by corporate America, according to Ksenia Bushmeneva, economist with TD Economics. She noted in a recent report, U.S. Consumer Spending: Still a K, but That’s OK, that budget-friendly industries like fast food have seen a drop in visits. As a result, some major brands added deals and value menu options to lure back budget-conscious consumers. In contrast, several airlines have added premium seats because wealthier consumers continue to travel while lower- and middle-income households pull back.
Ksenia stated that there are three major areas that have contributed to creating the K-shape in the U.S. economy:
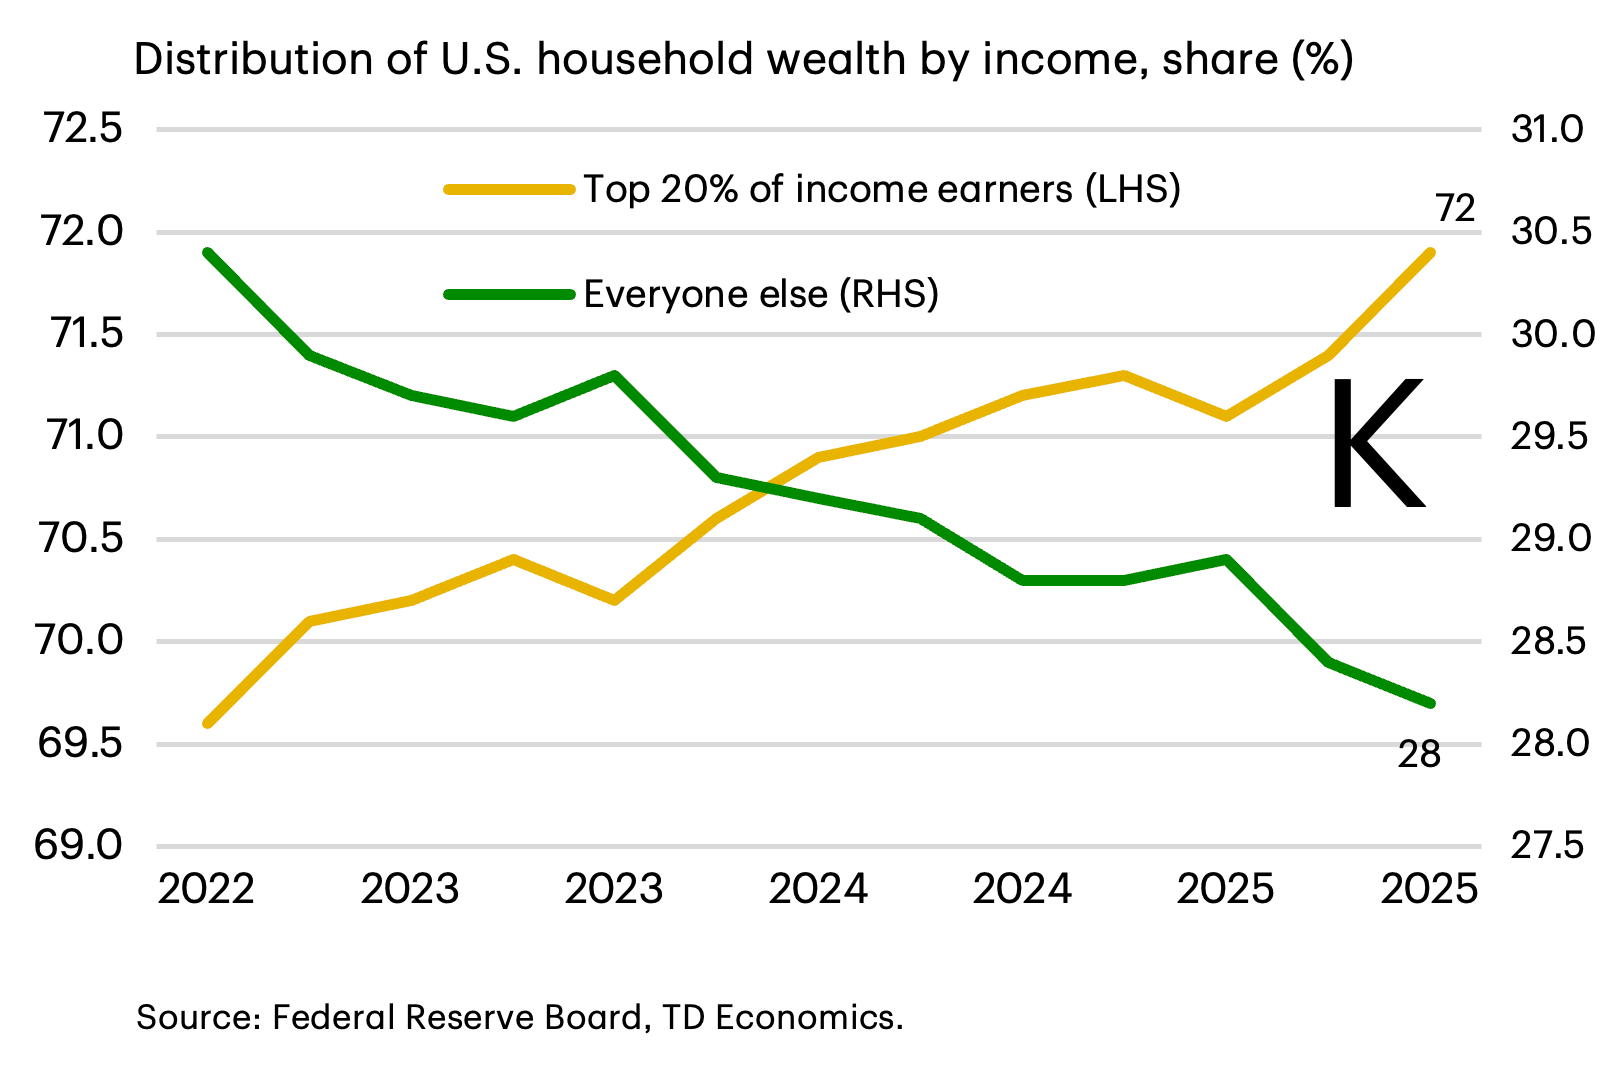
- Growing wealth divide: Household wealth is one area where the K-shape is clear. Wealth inequality has been growing since 2022. But the gap between households at the top of the income distribution and the rest widened noticeably last year, when 20% of Americans held nearly 72% of total household wealth, according to TD Economics research. Last year’s rally in the stock markets benefited high-income households more, since they typically hold a greater share of financial assets in their portfolios. Meanwhile, low- and middle-income households are more likely to count their home as their greatest asset, but both home prices and sales underperformed last year, and this housing market slump contributed to the widening divide among income groups.
Although wealth tends to have a much smaller impact on consumer spending than rising incomes, wealth gains still contribute positively. - Labor market cooling more for some than others: Data shows that wage growth for lower income workers barely kept up with inflation in 2025. In addition, low-income households are now spending more on essentials than they did prior to the pandemic. Spending on essentials — food, fuel, cell phone, transportation, utilities, housing, housekeeping supplies, health insurance and medical services — made up around 59% of all spending by households in lower income groups last year. This is a higher share than it was before the pandemic, leaving less money for discretionary purchases. By comparison, higher income households spent about 42% of their budget on essentials —slightly less than they did before the pandemic — leaving greater room for other purchases.
Unemployment rates also have risen more for some groups than others. The unemployment rate among young Americans (ages 20–24) and Black Americans grew quicker in 2025 compared to all workers in the market. Young workers are facing a tougher labor market in which some companies are hiring fewer entry-level positions because they have either seen or expect to see AI-led gains in efficiency and automation. - Consumer spending trends: Credit card data show that lower-income households barely increased their spending late last year, while high-income households spent more freely. It is also notable that spending outpaced disposable income last year, indicating that individuals and families relied more on savings and wealth gains to maintain their spending momentum. This trend suggests that the stock market gains gave a boost to spending by wealthier households. This is why, despite the growing gap between various income groups, overall consumer spending held up better than expected in 2025.
Consumer spending outlook for 2026
K-shaped consumer dynamics are likely to continue in 2026 partly because of new tax changes that could lead to middle- and high-income Americans seeing larger tax refund amounts, Ksenia stated in the report. Last year's refunds (for the 2024 tax year) averaged $3,167, and TD Economics estimates that average refunds could be $800 higher for the 2025 tax year. Consumers are likely to use some portion of their refunds to pay down debt or stash in savings, but a significant amount will be spent. On the other hand, analysis by the nonpartisan Congressional Budget Office does show this same legislation could weigh on lower income households, mostly because of reduced SNAP and Medicaid benefits.
Lower interest rates (with additional cuts by the Fed expected later this year) and some stabilization in the labor market could also support small increases in overall consumer spending in 2026.
“The American consumer is proving more resilient than we expected despite K-shaped dynamics under the surface,” Ksenia said. “Even as the gap between different consumer groups widens, household finances overall are still looking reasonably solid. Unless there’s a steep correction in the stock market or a sharp downturn in the job market, consumer spending is likely to remain robust.”
Read the full TD Economics report here.
We hope you found this helpful. This article is for informational purposes only and is based on information available from TD Economics as of February 2026 and is subject to change. This content is not intended to be used or acted upon with respect to any client's specific circumstances. For specific advice about your unique circumstances, consider talking with your qualified professionals.
No part of this publication may be reproduced in any form, or referred to in any other publication, without express written permission. All rights reserved.
©2026, TD Bank, N.A and/or its affiliates. All rights reserved